Who’s leading in Texas’ U.S. Senate race? We’re tracking poll results between Ken Paxton and James Talarico.
Aug 07, 2026 | 6:00 am ET
Description
Hien An Ngo
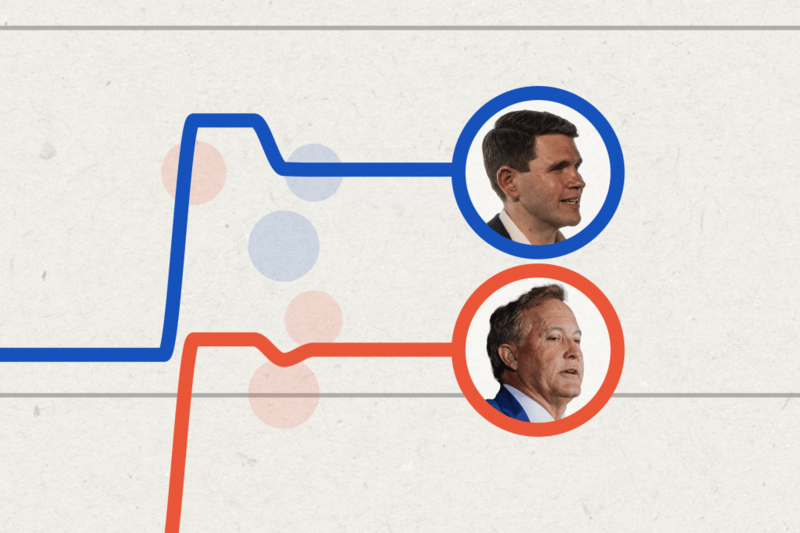
Texas’s candidates in this year’s U.S. Senate race remain neck and neck, according to recent polling. After the runoff election on May 26, Democratic nominee James Talarico has performed slightly better than Ken Paxton.
Notably, Talarico has enjoyed larger leads in recent polling than Democrat Beto O’Rourke ever did in 2018 when he nearly beat U.S. Sen. Ted Cruz.
How to read a poll
The quality of polls and pollsters can be measured by several metrics, including how well their polls have performed in the past and how transparent they are about their methodology. Here are a few things to pay attention to when navigating different polls.
Partisan sponsors: Polls sponsored by a candidate or party should be taken with a grain of salt, according to the American Association for Public Opinion Research. While nonpartisan polling organizations typically release all of their polling results regardless of who is ahead, candidate-sponsored or party-affiliated surveys can choose to only release results that benefit their campaigns.
Sample size: In general, the more people an election poll surveys the more reliable its results are. As sample sizes increase, the results of a survey are more likely to reflect the real attitudes of those who will vote in an election.
Sample type: Election polls usually survey three kinds of populations: adults, registered voters and those they deem to be “likely voters,” based on their voting history and gauged interest.
Polls that survey adults are able to increase their sample sizes, but can be less reflective of the opinions of those who will actually make it to the polls to vote on Election Day. During an election year, polls using samples of registered voters are common as they are a concrete group and more likely to vote than unregistered adults.
Closer to election day, polls with “likely voter” samples are often considered more representative of those who will actually vote. Different pollsters use different methodologies to determine who is a likely voter, using factors such as past voting behavior and interest in the election.
Sampling method: The methods by which pollsters select who participates in their surveys usually fall into two categories: probability and non-probability samples.
In a probability-based sample, every person of the full population has a chance of being selected for the survey, whereas in a non-probability based sample, such as an internet panel or a self-selected sample, the chance of any one person being selected is unknown. As a result, the samples can be skewed toward characteristics that may not be as reflective of the whole population.
Although probability based sampling has been the preferred method for many decades, its rising cost has led researchers to turn to non-probability based sampling. The results of some non-probability based surveys have been shown to be comparable to and sometimes more accurate than probability based surveys.
Margin of error: While polls conducted with probability samples allow for the calculation of the margin of error, non-probability polls have no simple way of calculating the same error metric. They must instead use statistical models to produce estimates of their sampling error.
Methodology for our tracker
Where the polls come from
The New York Times collects polls and manages a database of election polling. This tracker pulls data from their collection, and estimates the average of every poll conducted since Paxton won his Republican runoff election in May.
Which polls we include
We included every public poll of the Texas U.S. Senate that asked voters to choose who they would vote for if the election occurred that day and included James Talarico and Ken Paxton as options. Polls that ended before the May runoff election are not included in the average, but are listed in the table.
How the average works
The average is calculated by weighting every poll by three factors: recency, sample size and whether the poll’s sponsor has a partisan affiliation. We then averaged them.
- Recent polls count more than older ones as they are more reflective of current sentiment.
- Polls with larger sample sizes count more than those with smaller samples.
- Polls sponsored by a political party count half as much as ones without a partisan sponsor.
Limits
The average is not a forecast of the election and who will eventually win. Additionally, early in the race, the number of polls that have been released can be relatively low, meaning the average can shift meaningfully when a single new poll is added. As a result, individual outlier polls carry more weight early on.
Disclosure: The New York Times has been a financial supporter of The Texas Tribune, a nonprofit, nonpartisan news organization that is funded in part by donations from members, foundations and corporate sponsors. Financial supporters play no role in The Texas Tribune’s journalism. Find a complete list of them here.
Austin, TX