Shades of Trump in Oregon
Sep 03, 2026 | 3:34 pm ET
Description
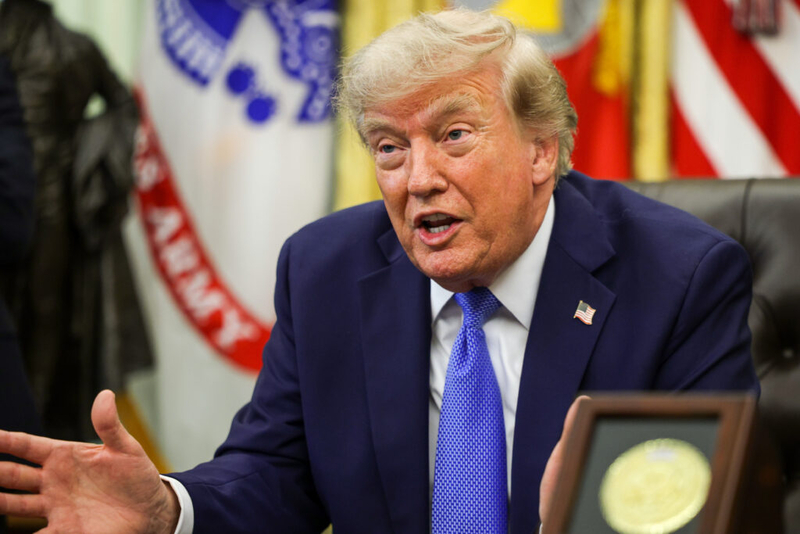
President Donald Trump speaks during an event in the Oval Office on Aug. 6, 2026. Trump signed an executive order during the event denying birthright citizenship to children of foreign diplomats after a loss at the U.S. Supreme Court limited an earlier order. (Photo by Alex Wong/Getty Images)
Oregon voters as a whole have not approved of Donald Trump any time he’s been on the general election ballot, handing him losses in 2016 (39.1%), in 2020 (40.4%) and 2024 (41%).
But parts of Oregon then and now have expressed different attitudes, as an election map of the state would show. Slicing the data in a different way, we now have a new report breaking the state’s current polling data into 35 geographic units, similar in number to the state’s 36 counties, but in this case each with similar populations.
This recasting shows up in a new national report in the polling analysis site Strength in Numbers, led by G. Elliot Morris (whose Substack is well worth a review), and drawing on an unusually large and detailed data set.
Nationally, it gives Trump an overall polling average of 38.2%, which if anything is a bit higher than some other polling aggregators conclude. Oregon, being a little bluer than the nation overall, gives Trump a job approval of 32.8%
Rather than using county maps, where enormous spaces may contain few people, and vice versa, distorting the voter picture, the report relies on Census Public Use Microdata Areas, or PUMAs. Each of the 35 in Oregon contains roughly 100,000 adults.
There are no massive surprises here. But we can see some sharp patterns.
First, the three — and there were only three — PUMAs where Trump polling approval topped 50%: the Klamath, Malheur, Lake and Harney four-county area (55.6%); the Union, Baker, Wallowa and southeastern Umatilla counties region (54.8%), and Douglas County (53.3%). That these areas support Trump is not surprising at all, though two years ago Trump scored 70% or more in nearly all these places.
Then there are the batch of PUMAs where Trump’s favorables have dropped below 50%, but still clearly above the national average: the Josephine, Coos and Curry counties area (49.1%); Deschutes (leaving out the city of Bend), Crook and Jefferson counties 47.7%); most of Linn County including Albany (46%), Marion County except Salem and Keizer (44.7%); the Columbia River counties from northwest Umatilla to Hood River County (44%); the cities of Medford and Central Point (43.9%); and southeastern Clackamas County (43.6%). Up to this point, the PUMAs have been essentially rural, with a few mid-sized cities thrown in (Medford, Albany, Grants Pass).
The Oregon PUMAs roughly matching Trump’s support nationwide include Jackson County minus Medford and Central Point (40.5%); Lane County except Eugene and Springfield (39.1%); Yamhill County (39%); Columbia, Clatsop, and Tillamook counties (38.2%); Northern Salem city and Keizer 37.4%; Polk and Lincoln counties (36.8%). These areas may hit close to the national average but still are more pro-Trump than Oregon overall.
Now, as the Trump numbers decline sharply, we move into urban and suburban areas, nearly all in the Willamette Valley (the big exception being the city of Bend, which is also in this group). These PUMAs include northwest Clackamas County including Oregon City (32.9%); central and southern Salem city (31.7%); the Milwaukee and Happy Valley areas in Clackamas County 31.3%; Springfield and northeast Eugene cities (29.7%); the Gresham, Troutdale and Gorge areas in Multnomah County (29.5%); Bend city (27.6%); Hillsboro area in Washington County (25.6%); Benton County and southwest Linn County (25.3%); the Wilsonville and Lake Oswego area in Clackamas County (25.9%), Forest Grove and western Washington County area (27.5%); the Tigard, Tualatin and Sherwood area in Washington County (25.5%); eastern Portland city (23.7%); and the Beaverton area (23.1%).
Finally, we get to the areas where you have to go on an intense search to find evidence of Trump support, though some does exist if you look for it. These places include central and western Eugene (20.7%); eastern Beaverton (19%); southeast Portland (13%); west Portland (11.6%); north-central Portland (10.9%); and east-central Portland (10.4%). For the record, Trump received 17.1%% of the Multnomah County vote in 2024, which still represented higher support than current polling indicates.
Viewed as a whole, the usual patterns — more Republican and Trump support in the more rural areas, and farther from large metro areas — seems to continue in force.
But those numbers are significant. They do seem to represent, both in red and blue areas, across the board decline in support for the president. If that has an effect on votes cast for other Republicans in the state, it could have a big impact on Oregon elections in another couple of months.
Salem, OR