The state of labor in Minnesota in 7 charts
Sep 07, 2026 | 7:00 am ET
Description
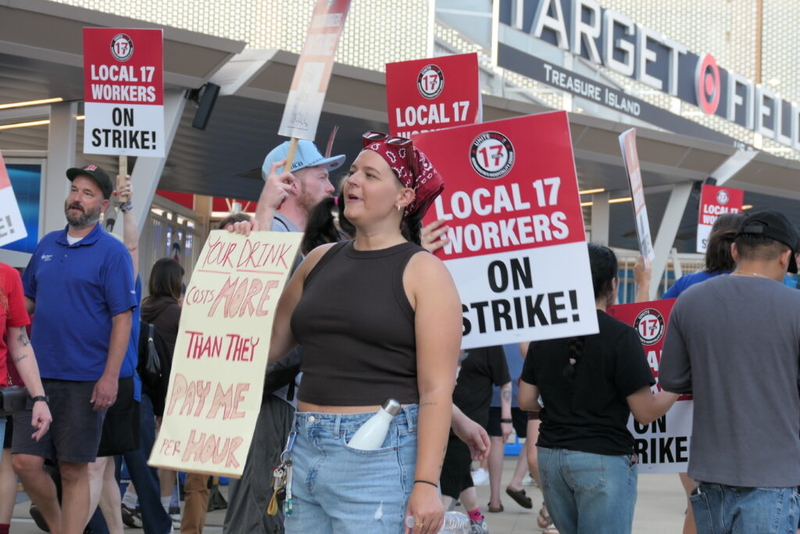
Dozens of concessions workers picket outside Target Field during a one-day strike on June 22, 2026. (Photo by Max Nesterak/Minnesota Reformer)
Minnesota’s labor market faced some turbulence over the past year, in part from the surge in immigration enforcement over the winter that left many immigrants afraid to leave their homes to work and shop.
Unemployment in the state surpassed national rates in January for the first time since 2007, reaching its highest levels in five years. Labor participation — the rate at which Minnesotans are working or looking for work — also declined sharply starting in January, though that trend is more in line with national numbers.
At the same time, Minnesota continues be a good place to work, with higher wages, job growth and union density than the nation as a whole, as well as worker protections such as the state’s new paid leave program.
Here are six charts on the state of labor in Minnesota.
Minnesota has had lower unemployment compared to the rest of the U.S. since at least the 1970s, according to the Bureau of Labor Statistics’ Current Population Survey.
There are two exceptions: in 2007, as the Great Recession was emerging; and in 2026, starting in January.
The January spike in unemployment coincided with Operation Metro Surge, during which people were afraid to leave their homes and encounter agents who shot three people, killing two, and detained citizens and legal immigrants. The last time unemployment was this high in Minnesota was five years ago, in 2021.
The Minnesota Department of Employment and Economic Development linked the state’s weak February jobs numbers with the federal law enforcement surge.
“February was a very challenging month for Minnesota communities due to the ICE presence, and that also contributed to it being a tough month for the state’s labor market,” said DEED Commissioner Matt Varilek in a statement.
Still, it’s not yet clear how much the dip in employment levels comes directly from the ICE surge. Unemployment in Minnesota has been steadily rising since a low in 2022.
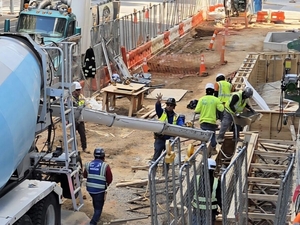
Minnesota lost jobs, especially in construction and hospitality, during the winter’s ICE surge. Data from the Bureau of Labor Statistics show that Minnesota had 4,300 fewer construction jobs and 5,900 fewer hospitality jobs in February compared to the pre-surge November. The numbers are seasonally adjusted, meaning they take into account the expected annual dip in construction jobs in the winter.
Jobs numbers have bounced back since, growing 1.4% overall from June 2025 to June 2026. Mining and logging, construction, education and health services saw the biggest growth over the 12 months, while the finance and information sectors lost jobs.
An April report from progressive think tank North Star Policy Action said the steep declines over the winter in industries that employ significant numbers of immigrants, such as food service and construction, strengthen the case that Operation Metro Surge had a chilling effect on the state’s economy. The report found that Minnesota’s loss of construction jobs was the highest in the nation from December to February, the three months of the surge.
Minnesotans earn the highest average hourly wages in the Midwest — and the 6th highest in the nation — while enjoying a relatively low cost of living compared to the coasts.
The average hourly wage in Minnesota was $39 in 2025. According to the state Department of Employment and Economic Development’s 2025 cost of living calculator, a single person with no kids needed to earn around $18 an hour while a family of four with one working parent needed to earn around $35 per hour to afford the basics.
Hennepin County had by far the highest average wages in the state in the first quarter of 2026, followed by Ramsey County and Olmsted County, where Mayo Clinic is the largest employer.
Rates of union representation in Minnesota continued to go up in 2025, with nearly 16% of workers represented by a union. The state consistently has among the highest rates of union representation in the country owing to its pro-labor tradition and relatively favorable organizing laws. High union density helps bolster both union and non-union wages.
Union participation has been declining over the past half century, though, despite a resurgence in support in recent years. Union leaders blame the decline on federal laws hostile to organizing and a lack of meaningful enforcement against unfair labor practices.
Income inequality remains high across the country, including in Minnesota, where the top 10% of earners made 37% of all income in 2024.
Minnesota’s Gini coefficient — a metric of inequality that ranges from 0, representing exact equality, to 1, representing one person making all the money — stayed at .42 in 2024, slightly higher than Iowa’s and Michigan’s but still lower than the national average.

Saint Paul, MN